October 5, 2011

Bottoms - Weekly Charts

I have compiled a library of bottoms in the S&P 500 since 1970 using weekly charts. The first chart is a monthly 40 year chart, the rest are weekly charts showing some of the bottoms from the monthly chart. Thanks to Telechart for the charts. Enjoy.

S&P Monthly 1970 - 2011


S&P 500 Weekly – 2009 Bottom


S&P 500 – 2003 Bottom


S&P 500 – 1990 Bottom


S&P 500 – 1987 Bottom


S&P 500 – 1982 Bottom


S&P 500 – 1980 Bottom


S&P 500 – 1978 Bottom


S&P 500 – 1974 Bottom


S&P 500 – 1970, 1971 Bottoms

October 2, 2011

Wheelhouse View of the Market

Storms on the horizon? The market indices are poised to test the summer lows, and the price action does not look promising. However, market breadth, though negative, is in extreme oversold zones on the Market Monitor primary indicator. Secondary indicators are not oversold though, which leaves the door open for more downside in the shorter term. VIX looks like it wants to go higher, making higher lows and if it was a stock I'd be watching for a breakout.

Several things can happen here: we either go through the lows like butta and go into free fall, we test the lows and hold to continue the range, or we test the lows for a few days before breaking them. In any case, I am not doing any swing trading but will day trade as my schedule allows. I did one trade last week on GMCR and lost 0.5%, and the market was very odd last week, so I packed it in for the week after that. This week I should have the opportunity for at least two days to do some day trading. The T works in bull or bear conditions, just have to know how to trade your stocks.

Have a great week and a profitable one. Here's the uglies:


September 28, 2011

Wednesday Weeversal

As I sit and watch my Braves do all they can to blow their season, and after a reversal from Tuesday's highs to Wednesday's lows, I figure it was a good time to take another look at where we are to distract me from the inevitable down fall of my favorite baseball team. But I digress...

Charts below are the S&P, Nas Comp, $RUT, and VIX. The major indices failed at their 50-day and the $RUT never even made it that far, as has been noted in earlier posts. The $RUT has lagged this recent bounce. The VIX looks bullish if it was a stock. Unfortunately for stocks, it isn't a stock. Not looking to good for the market, and failure to hold recent lows will possible bring some issues for stocks with it. Depends on where we are when we get there, if we get there.

Breadth is still not promising for swing trades from the long side. With the high volatility, day trading is still the name of the game, and remaining in cash otherwise. This has been a profitable formula last couple of months so I will stay with it until Mr. Market decides to favor that strategy.

Good luck the rest of the week, here are the charts:


September 25, 2011

Wheelhouse View of the Market

Interesting past few weeks for the market. The indices are all at the August lows; in the case of the $RUT, it is just below the lows. Primary breadth indicator on the Market Monitor is near extremes, and we have had a bearish thrust last couple of weeks. The market is certainly in an area of opportunity for a bounce. But I would have liked to have seen a bad day Friday to punch through the August lows, getting us more oversold than we are, and then snapping back above those lows. Instead we got a dead cat bounce.

Any bounce from here may be tradable, particularly with end of month this week; but without the breadth thrust, a tradable bounce is all it will be, before the next leg down. Currently in cash and taking day trading opportunities as my schedule allows. I am now in the green ever so slightly for the year so, not getting aggressive with swing trading from either side yet; when I do, I will be focusing on the post earnings surprise list from Bluefin. Volatility is still pretty high and great for day trading.

The charts below are the VIX, Dow 30, and $RUT. As you can see, we are at support areas but seem to be holding on by a nail. Good luck this week.

VIX


$RUT


$DJI

September 23, 2011

Today's Trades


Did a couple of day trades today, both on the same stock, SINA. This stock is a China stock that moves nicely intraday.

Trade #1: This trade was entered in the morning, after the opening action. The stock made a nice push on a large green frame to start the move, then pulled back and reset. I entered on the first yellow arrow, and the two blue arrows are my exit. The second exit was based on the expectation that once it passed the $86 area, it would test the gap at $87.60 or so. So I put a limit order just below the gap at $87.50 and moved my stop up to $86.00, my previous exit point. Worst case I make $1.60 a share, best case I average out to $2.40 a share profit, which is what happened. Probably one of the more satisfying trades I have had lately. But then I put a small ding in it with trade #2.

Trade #2: This trade, quite frankly, should have been entered on the frame before I entered. There's a little green candle, almost a doji, a couple of frames prior to the large green frame. The frame after entry was a flag pole and red frame closing on lows with a flat ema, so I cut it loose for a loss of 7 cents. Probably should have accepted the fact that I missed the optimal entry, but it feels good to be in cash and have a good day.

I'll have my weekly review of the market over the weekend. Till then, be merry.

September 21, 2011

Comparing Recent Bull and Bear Markets

Dow weekly charts for 2003-2007 bull, 2007-2009 bear, 2009-2011 bull, and 2011 top are below. See the similarities. Current situation looks a lot like early stage of last bear market. And all the news that comes with it too. Look out below, could still get bumpy over larget time frame; today's move down has been setting up for weeks now.

2003-2007 (see the top at right edge)


2007-2009 bear and 2009-2011 bull:


Zoom in on 2009-2011 bull...looks similar to last top in 2007:

September 20, 2011

Wheelhouse View of the Market


I was just taking a look at the indices tonight, and it really doesn't look that good. We have essentially consolidated in a range up to the 50-day sma's on each index. The $RUT couldn't even make it that far. A down leg from here is certainly possible. Today's action was not great either, and with a FOMC meeting tomorrow the volatility will be up there.

Still only day trading when schedule allows. It allows tomorrow :)))

Happy Trading

September 7, 2011

Wheelhouse View of the Market

If you take a look at the Dow 30, Nasdaq Composite, and the Vix, they all look to be forming a range or channel working towards the 50 day sma. The bearish flag on the Dow/SP/Wilshire/NYSE are essentially ranges with today's rally off the bottom of the flag. Nasdaq looks less bearish but is still below the 50 sma. The market is looking more like it needs some range bound action...accumulation...before getting into bull market territory again.

Day trading remains the name of the game for now. RIMM was my only day trade today, went 113% on margin and took a quick 40 cents in a 30 minute trade. Made 1.4% on the account...took me more time than that to eat my lunch afterward. I'll take it...one more brick. Good luck rest of the week.


One for the Aces

A member from Tumblertrades.com emailed me asking how I have melded swing trading and "The T" ( Tumbler's day trading method). Hoping to explain that a little here...

The book Hedge Fund Edge explains a little how to use multiple time frames in your trading. HFE talks about taking a trade to the next time horizon. How is that done? For me, in a nutshell this means that I enter on an intraday chart for a day trade, but the daily helps me decide how long I can stay.

I am not saying the exit rules of the T are not applied to the trade, because they are. However, the daily chart (maybe hourly for some works better) can tell me many things about my day trade (list is not all inclusive):

1. Whether to take one good day trade setup over another, assuming all else equal (i.e. catalyst and reward/risk same and both good setup for T).

2. Whether to hold thru intraday pullbacks above the 4/15 or 8/15 or sell at first exit chance (i.e. red frame up the line).

3. Whether to hold a day trade overnight or exit by close. Especially in the current market, this usually means selling a strength frame the next morning. Guess who is buying those shares from us? Many folks that ran a scan the night before and see the stock had a breakout on their daily charts, they buy the morning, from us.

As you can see I did not invent anything I just used the T to compliment and improve my existing trading methods. I do not trade exactly like him, I trade a lot less frequently. And this is still new to my trading, so it is not perfected yet. Tumbler emailed my trades to the Aces last month DECK PEET and LNKD. You can see especially with DECK and PEET how the daily chart can tell me whether to see if there is more. Both were eps catalysts in hot sector also.

Look at examples today - AMZN, PANL, GMCR all good day trades avalable, daily chart bouncing off the 50 day on big green candles. Market bouncing from oversold intraday. Do you sell the close today or see if there is more tomorrow? Your call :)))

Good luck to all of you and study those chart chats...they are an underrated learning tool in my book.

September 2, 2011

Bearish Flaggishness Part Deux continued...


Pure luck would have it that the Dow reversed right at resistance and the top line on the bear flag. I thought it would at least make an attempt at 11,900 first but the jobs numbers may have been too much for the bulls. For now at least. Would not be surprised to see a test of the lows again. As has been the case recently, day trading is best option right now. I am getting close to a month without doing a trade though. Perfect storm of vacation and backlog at work has given me a good time to take a little break, involuntarily in part. But that is winding down a bit and should allow more time for some intraday trades if conditions persist.

Have a great weekend everyone.

August 30, 2011

Bearish Flaggishness Part Deux

Let's revisit the bearish flag potential after two days of action this week. We have rallied near the bottom of the 11,600-11,900 resistance area at a pretty good angle. And then we got some profit taking today late day. Saw some resistance today, will see how the next few days shape up. Labor day coming up too...hard to imagine a breadth thrust over Labor day holiday weeks.

Nasdaq chart doesn't look as flaggish, which may be a sign that this pattern will not hold. We shall see.


I am not swing trading in this environment, would like to see clearer market direction. So, I will finally have a little time to do some day trading tomorrow if the oppurtunity presents itself. Not much news flow, but enough stocks moving with catalysts and at least recent news to move with.

Two earnings reporters from this evening that I am watching tomorrow intraday (not at the open) are VRA and PVH. Both up after hours and both beat eps/revs and raised guidance. Will likely gap up tomorrow but will look for a pullback after the first hour.

Good luck tomorrow.

August 28, 2011

Bearish Flaggishness

Take a zoomed in look at this chart of the Dow 30. I have extended the chart and connected the recent upward sloping lows. I created a parallel line to that to project out the possible pattern, and it could be forming a bearish flag over a period of weeks. It is tough to know when the market will make its decisive move rather than simple a move within a range...but you can see the patterns start to develop as they happen. This of course does not mean it will materialize.

The Dow 30 looks like it wants to try to test the 50 ma from below sometime soon, between 11,600 and 11,900 is the resistance zone. This also around 50% retracement of the recent decline, so beware of rallies into this area. We could very well get another leg down from there, so I am keeping my powder dry aside from day trading potentials. Patience is an absolute necessity right now for swing trading, and abstinence may be the best policy. But a little day trading here and there is in the cards with a volatile market.

Good luck this week all, and hope everyone got through the hurricane safely.


August 27, 2011

Methods I Use

Just to give you a framework of how I trade, I really use only three methods. One of them is a day trading method that I have married into my swing trading. All three methods I learned from other traders that have their own subscription blogs, for that reason I will not get into the specific criteria of their methods. However, the methods below are what I have in my tackle box:

1. Stockbee Trend Intensity - this method was created by Stockbee (stockbee.biz) and is essentially a momentum based swing trading method. I use both breakout and pullback entry techniques when using this method, although the method is breakout-based. It is only used in bullish market conditions as determined by Market Monitor, a breadth based market timing model developed by Stockbee. This method works great in bull markets, including the recent bull market.

2. Earnings EP Pullbacks - This is a PEAD (Post Earnings Announcement Drift) and earnings/catalyst based method...it is based on the Episodic Pivots method from Stockbee. This is really a subset of that method in that it looks for stocks with large up days on their earnings day and a positive surprise, but trades the initial pullback after that price reaction. This method does not enter on the day of the episode but takes the next train. The watchlists I use are from Bluefin (patientfisherman.blogspot.com) that track stocks making big moves on earnings day and stocks with good earnings surprises. I prefer to use this going into and during earnings season periods.

3. The T - This is a day trading method I learned from a guy named "Tumbler" that I met on the Stockbee site. He's the most consistent day trader I know, and has a really straight forward way of doing it. See his site for the best description (www.followtumblertrades.com). I also use this as a method of entering swing trades in the right conditions. I like to take the trade to the next time frame when possible and get bang for the buck. I prefer to use this in volatile times and when other methods are not in play. If I had to pick one method to trade and I had the intraday availability, this is the one I would trade. Otherwise it would be the earnings pullbacks.

So that is the general description of the methods I use. The details are spawn from my experience, my schedule, and my style. The foundations I learned from the sites I mentioned. This site is a way to document my own journey through this market ocean, and to learn some things along the way.

Wheelhouse View of the Market

This is the start of what I hope to be a weekly feature just looking at the weekly state of the market. This week I will look just at the SP500, COMPQ, and the VIX daily charts. Nothing highly technical...

Essentially we have broken down and gotten into a tightening volatile range after the decline. The market truly could go either way here, but without significant evidence to the contrary I have to assume the range will result in continuation of either the range or the decline. It looks like it wants to try the bottoms again before making its move, but expectations don't always materialize.

As far as methods, day trading is the best way right now, but I have been so busy with other work that I have not been able to do much of that since early August. Until breadth improves, this is the way it is.


August 16, 2011

Waiting for twilight...

Went on vacation last week. We fished a lot all day but mainly had success very early and very late in the day. By the third day, we realized we were better off just wading in the river and enjoying just observing the surroundings in the middle of the day because the fish just weren't biting. Honestly, I am so much better at trading than fishing. But they are very similar skills in many ways.


Market corrections come and go like feeding times and breeding cycles. When using swing trading methods on daily/weekly/monthly time frames, you have to worry about this stuff more than say, a day trader.

The stocks I researched all had corrections of weeks before their best moves. They were all low float, low priced, and some had earnings while others did not. We have beaten that horse maybe not here but every where else. It's established. But market timing...knowing when to put your bait in the water...is required to be a more efficient swing trader. It keeps you in when odds are in your favor, and keeps you wading and watching when odds are not in your favor.

So the question also remains for all of us: what is your style? Are you a day trader? Are you a swing trader? Are you both? I have had to search for this answer myself, as recently as a few minutes ago.

I recommend reading page 346+ of The Hedge Fund Edge, where it talks about taking a trade to the next time horizon. I always thought of it as taking the trade to the next bigger chart. I have been looking at this a lot lately as I have experimented with adding day trading to my skill set. Not frequent trading, but day trading. We are talking 0-5 trades a week. A day trade may become a 2-5 day trade in the right conditions.

So my answer for myself...is I am both. I may use day trading entry methods on a 15-minute chart and swing trading exit methods on an hourly or daily chart. All this means is that I look at the bigger chart as a guide for my 15-minute trade.

As a trader I have undergone some reconstruction this year and have gotten back to even from being down a little less than 10% ytd. So I feel like I have a chance to start the year over. The thing about it is that I am using methods created and taught by two great traders and teachers. I will not re post their methods here, although I probably could. The reason is because it will do you no good without going through what other successful traders have gone through. There are no shortcuts.

See the links on this page to Stockbee.biz and TumberTrades.com. Stockbee is a blog and learning site focused on swing trading. I learned about market timing and market breadth with the site, and I use his market timing indicator, Market Monitor, for my swing trading. There is infinite value on the site.

TumblerTrades is run by a trader I met on Stockbee who evolved into a day trading artist. He has been called a machine, but I see after talking with him that he is an artist. He is by far the best day trader I know and the most consistent.

The other important link I use is the Patient Fisherman, also run by a trader I met on Stockbee. I use this site for all of my momentum and PEAD based watch lists. It is also good for getting Market Monitor data over the web without need for Telechart.

Happy Trading

April 24, 2011

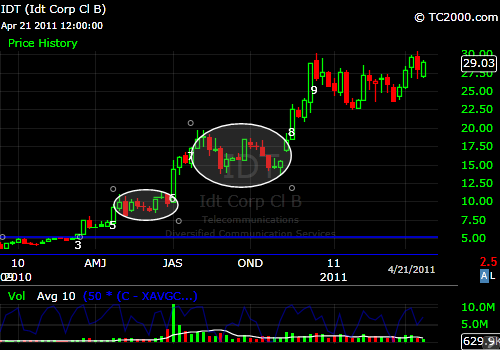
Weekly Charts File - Bases

Good Evening,
Below are the weekly charts for the eight stocks I studied, each with the primary bases during the 500% move circled on the chart.

Note that these stocks typically have two or more bases on the weekly chart during the move. If you are looking for a method to make 50% and pyramid into a stock, these are likely good places to pyramid into a position.

Look at several things in the bases:

- How far does the stock pull back from recent highs in its base. Prefer that stock stay near recent highs in its consolidation.
- How long is the base?
- Is there volume dry up in the base?
- What is the typical price action within the base (i.e. tight ranges or choppy action, or typical patterns)?


April 22, 2011

Weekly Charts File

Here are the weekly charts for a little over a year on the eight stocks I studied. Study these for similarities and patterns. What things repeat themselves chart after chart?


March 28, 2011

Next Steps

Next step is going to be to try to summarize what has been found so far. This will include sorting through and ranking the various factors or characteristics that accompany these stocks. That will be ongoing behind the scenes and I will post as time allows. My trading comes first and when not active I will be updating this.

Once I have the stuff summarized I will attempt to figure out a method to find such stocks. It is very likely there is already a method right in front of me. If so, fine. What better way to understand fire than to create it all over again.

After the "method" to find these stocks is determined, I will move the theme of this blog to more of a watchlist oriented blog. I won't be doing intraday stuff here - I'm on Stockbee during the day. I'll use this site to post trade ideas long and short, but the trades will fit my process of trading as someone with a full time job.

In the meantime, I will be posting stocks that I am watching long and short on Stocktwits at http://chart.ly/users/swingtrader4. I'll also be over on Stockbee for those of you that are members.
See ya soon...